
![]()
![]()
![]()
The EquityTool has been updated based upon new source data. The original version is no longer active but is available upon request.
Previous version released: June 28, 2018
Source data: Guinea MIS 2021
# of survey questions in full wealth index: 48
# of variables in full index: 129
# of survey questions in EquityTool: 13
# of variables in EquityTool: 14
Questions:
| Question | Option 1 | Option 2 | Option 3 | Option 4 | |
| Q1 | Does your household have a wardrobe? | Yes | No | ||
| Q2 | …a bookshelf? | Yes | No | ||
| Q3 | …electricity? | Yes | No | ||
| Q4 | …a television? | Yes | No | ||
| Q5 | …a refrigerator? | Yes | No | ||
| Q6 | …a sofa? | Yes | No | ||
| Q7 | …a fan? | Yes | No | ||
| Q8 | Does any member of your household have an android phone? | Yes | No | ||
| Q9 | …an account in a bank or financial institution? | Yes | No | ||
| Q10 | In your household, what type of cookstove is mainly used for cooking? | Three stone stove / open fire | Other | ||
| Q11 | What type of fuel or energy source is used for cooking? | Wood | Other | ||
| Q12 | What is the main material of the floor of your dwelling? | Ceramic tiles | Cement | Other | |
| Q13 | What is the main material of the exterior walls of your dwelling? | Cement | Other |
Technical notes:
During the initial steps of creating this EquityTool it was discovered that the urban and rural sample sizes provided within this DHS’s supporting documentation did not correspond to those found within the dataset itself. These discrepancies limited our ability to validate many of the descriptive statistics we consider for inclusion during the EquityTool creation process and also raised questions about how the wealth index provided in the dataset was produced. For these reasons, we chose to recreate the wealth index and to use our newly recreated wealth index as the standard against which we would later compare interrater reliability of the simplified EquityTool wealth index. The standard simplification process was applied to achieve high agreement with the original wealth index. However, after completing the standard simplification process, an additional variable was added to improve the indices’ ability to discriminate between the first and second quintiles. Details on the standard process can be found in this article. The data used to identify important variables comes from the factor weights released by ICF.
Level of agreement:
National Population (n=3985) | Urban only population (n=1342) | |
| % agreement | 86% | 84% |
| Kappa statistic | 0.79 | 0.75 |
Respondents in the original dataset were divided into three groups for analysis – those in the 1st and 2nd quintiles (poorest 40%), those in the 3rd quintile, and those in the 4th and 5th quintiles (richest 40%). After calculating their wealth using the simplified index, they were again divided into the same three groups for analysis against the original data in the full MIS. Agreement between the original data and our simplified index is presented above.
What does this mean?
When shortening and simplifying the index to make it easier for programs to use to assess equity, it no longer matches the original index with 100% accuracy. At an aggregate level, this error is minimal, and this methodology was deemed acceptable for programmatic use by an expert panel. However, for any given individual, especially those already at a boundary between two quintiles, the quintile the EquityTool assigns them to may differ to their quintile according to the original MIS wealth index.
The graph below illustrates the difference between the EquityTool generated index and the full MIS wealth index. Among all of those people (20% of the population) originally identified as being in the poorest quintile, approximately 75% are still identified as being in the poorest quintile when we use the simplified index. However, approximately 21.5% of people are now classified as being in Quintile 2. From a practical standpoint, all of these people are relatively poor. Yet, it is worthwhile to understand that the simplified index of 13 questions produces results that are not identical to using all 48 questions in the original survey.
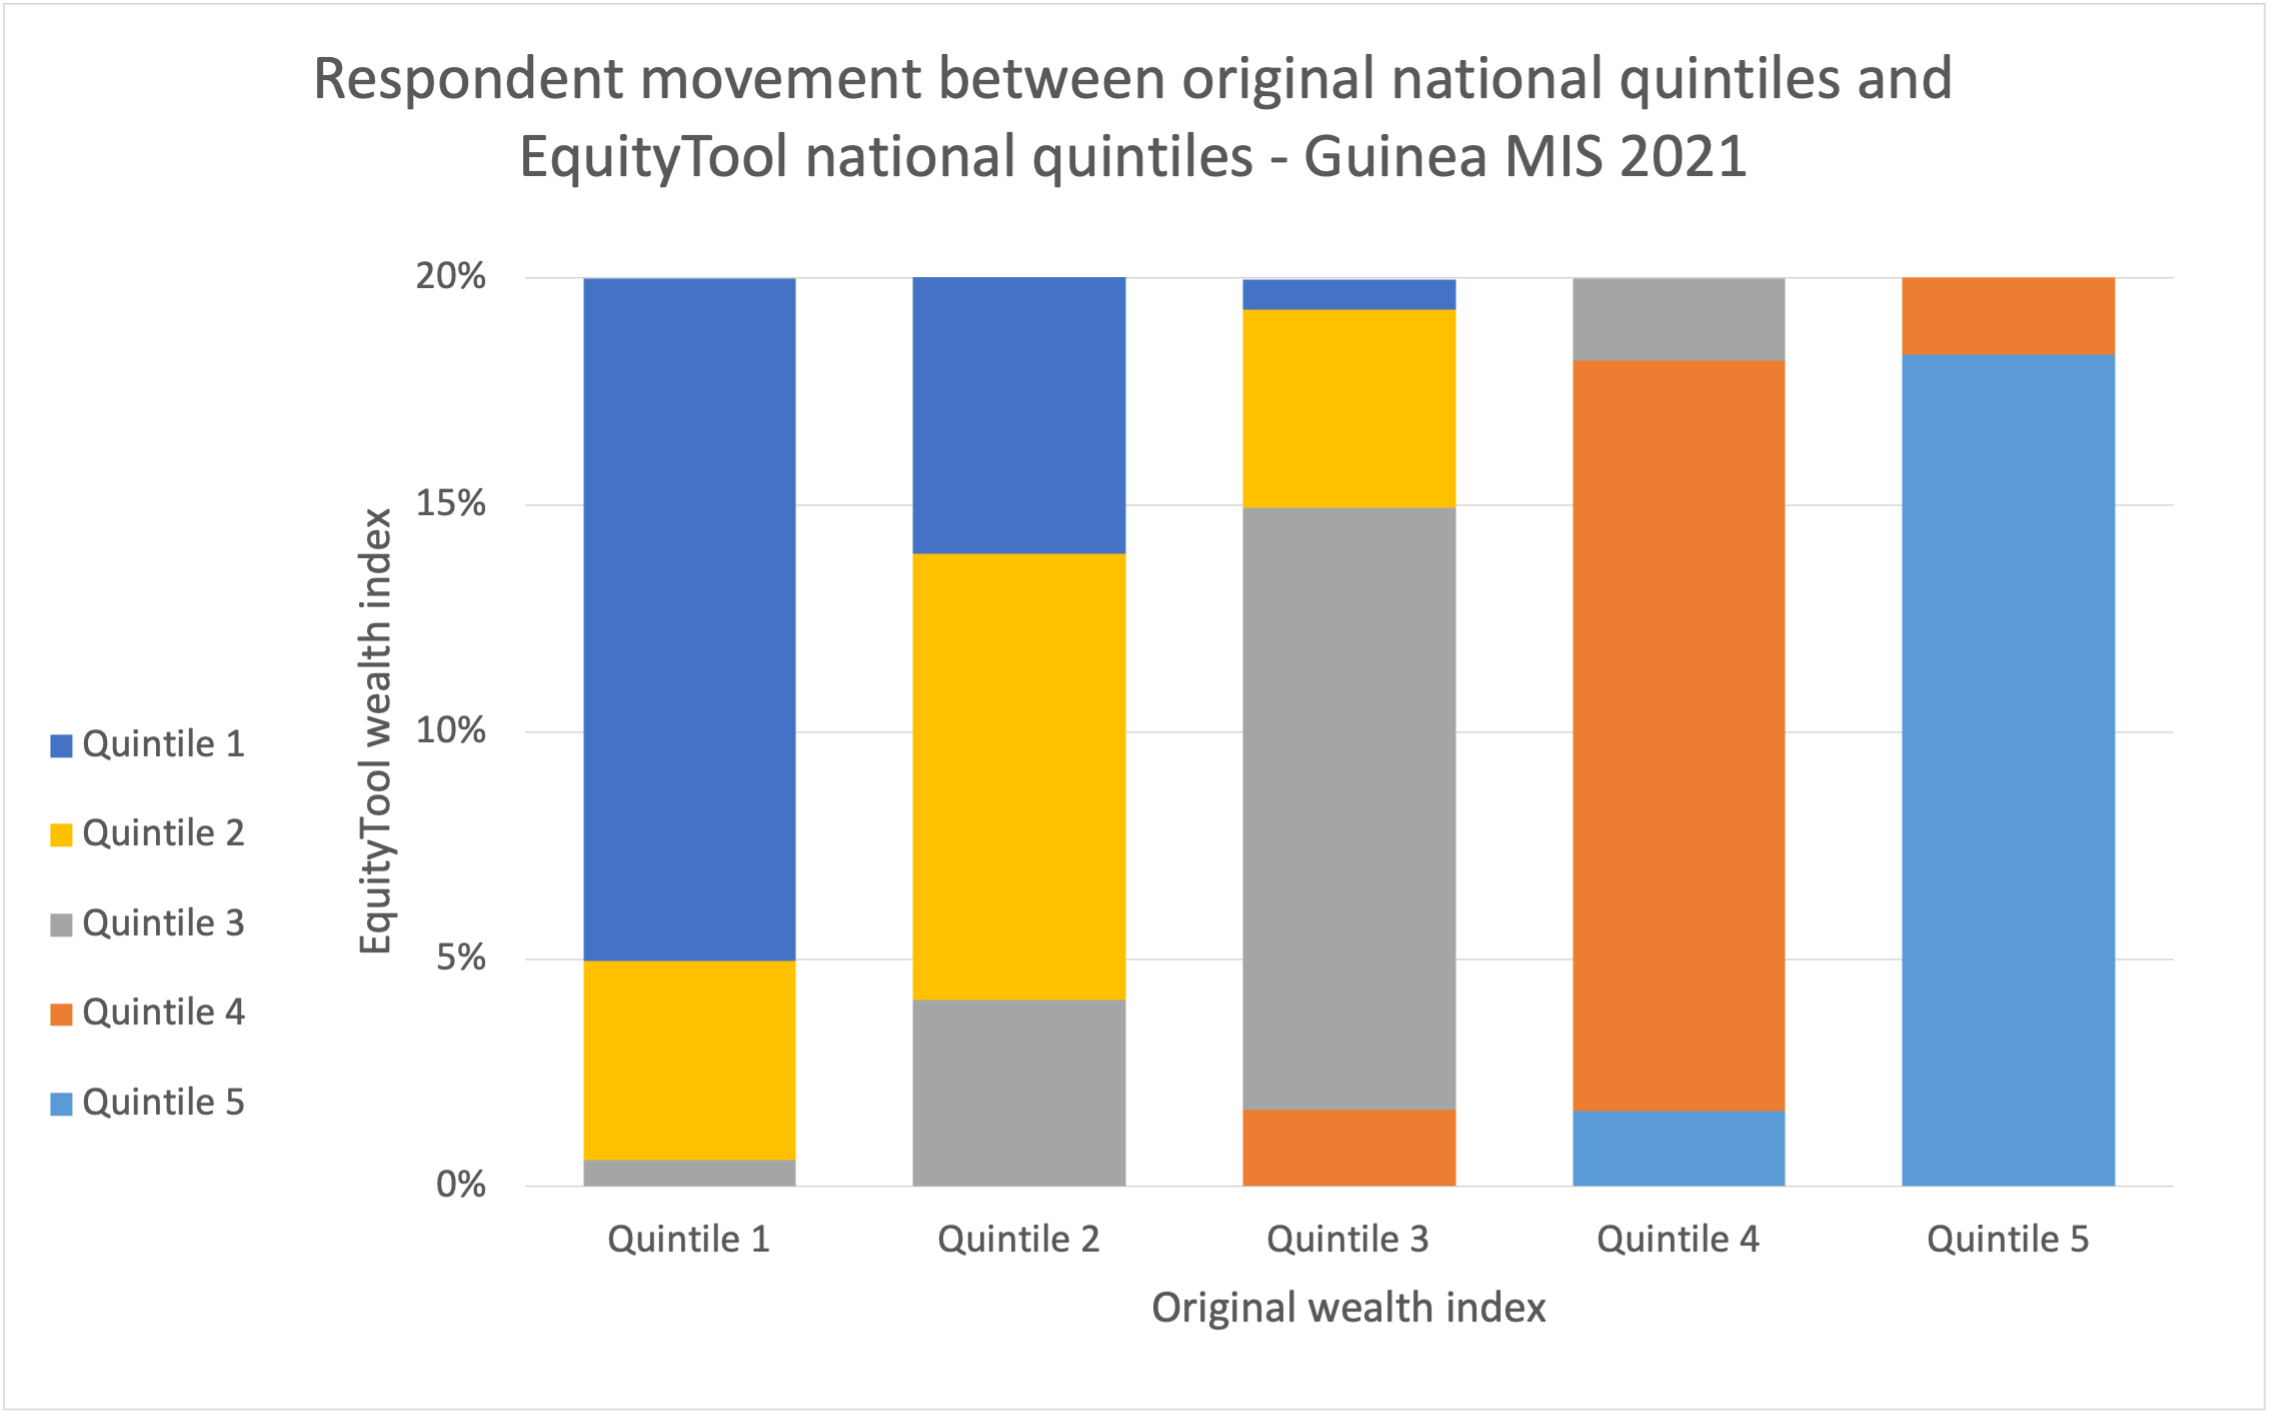
The following table provides the same information on the movement between national quintiles when using the EquityTool versus the original MIS wealth index:
| EquityTool National Quintiles | |||||||
| Quintile 1 | Quintile 2 | Quintile 3 | Quintile 4 | Quintile 5 | Total | ||
| Original MIS National Quintiles | Quintile 1 | 15.0% | 4.4% | 0.6% | 0.0% | 0.0% | 20% |
| Quintile 2 | 6.1% | 9.8% | 4.1% | 0.0% | 0.0% | 20% | |
| Quintile 3 | 0.7% | 4.4% | 13.3% | 1.7% | 0.0% | 20% | |
| Quintile 4 | 0.0% | 0.0% | 1.8% | 16.5% | 1.7% | 20% | |
| Quintile 5 | 0.0% | 0.0% | 0.0% | 1.7% | 18.3% | 20% | |
| Total | 21.78% | 18.58% | 19.76% | 19.90% | 19.98% | 100% | |
The following graph provides information on the movement between urban quintiles when using the EquityTool versus the original MIS wealth index:
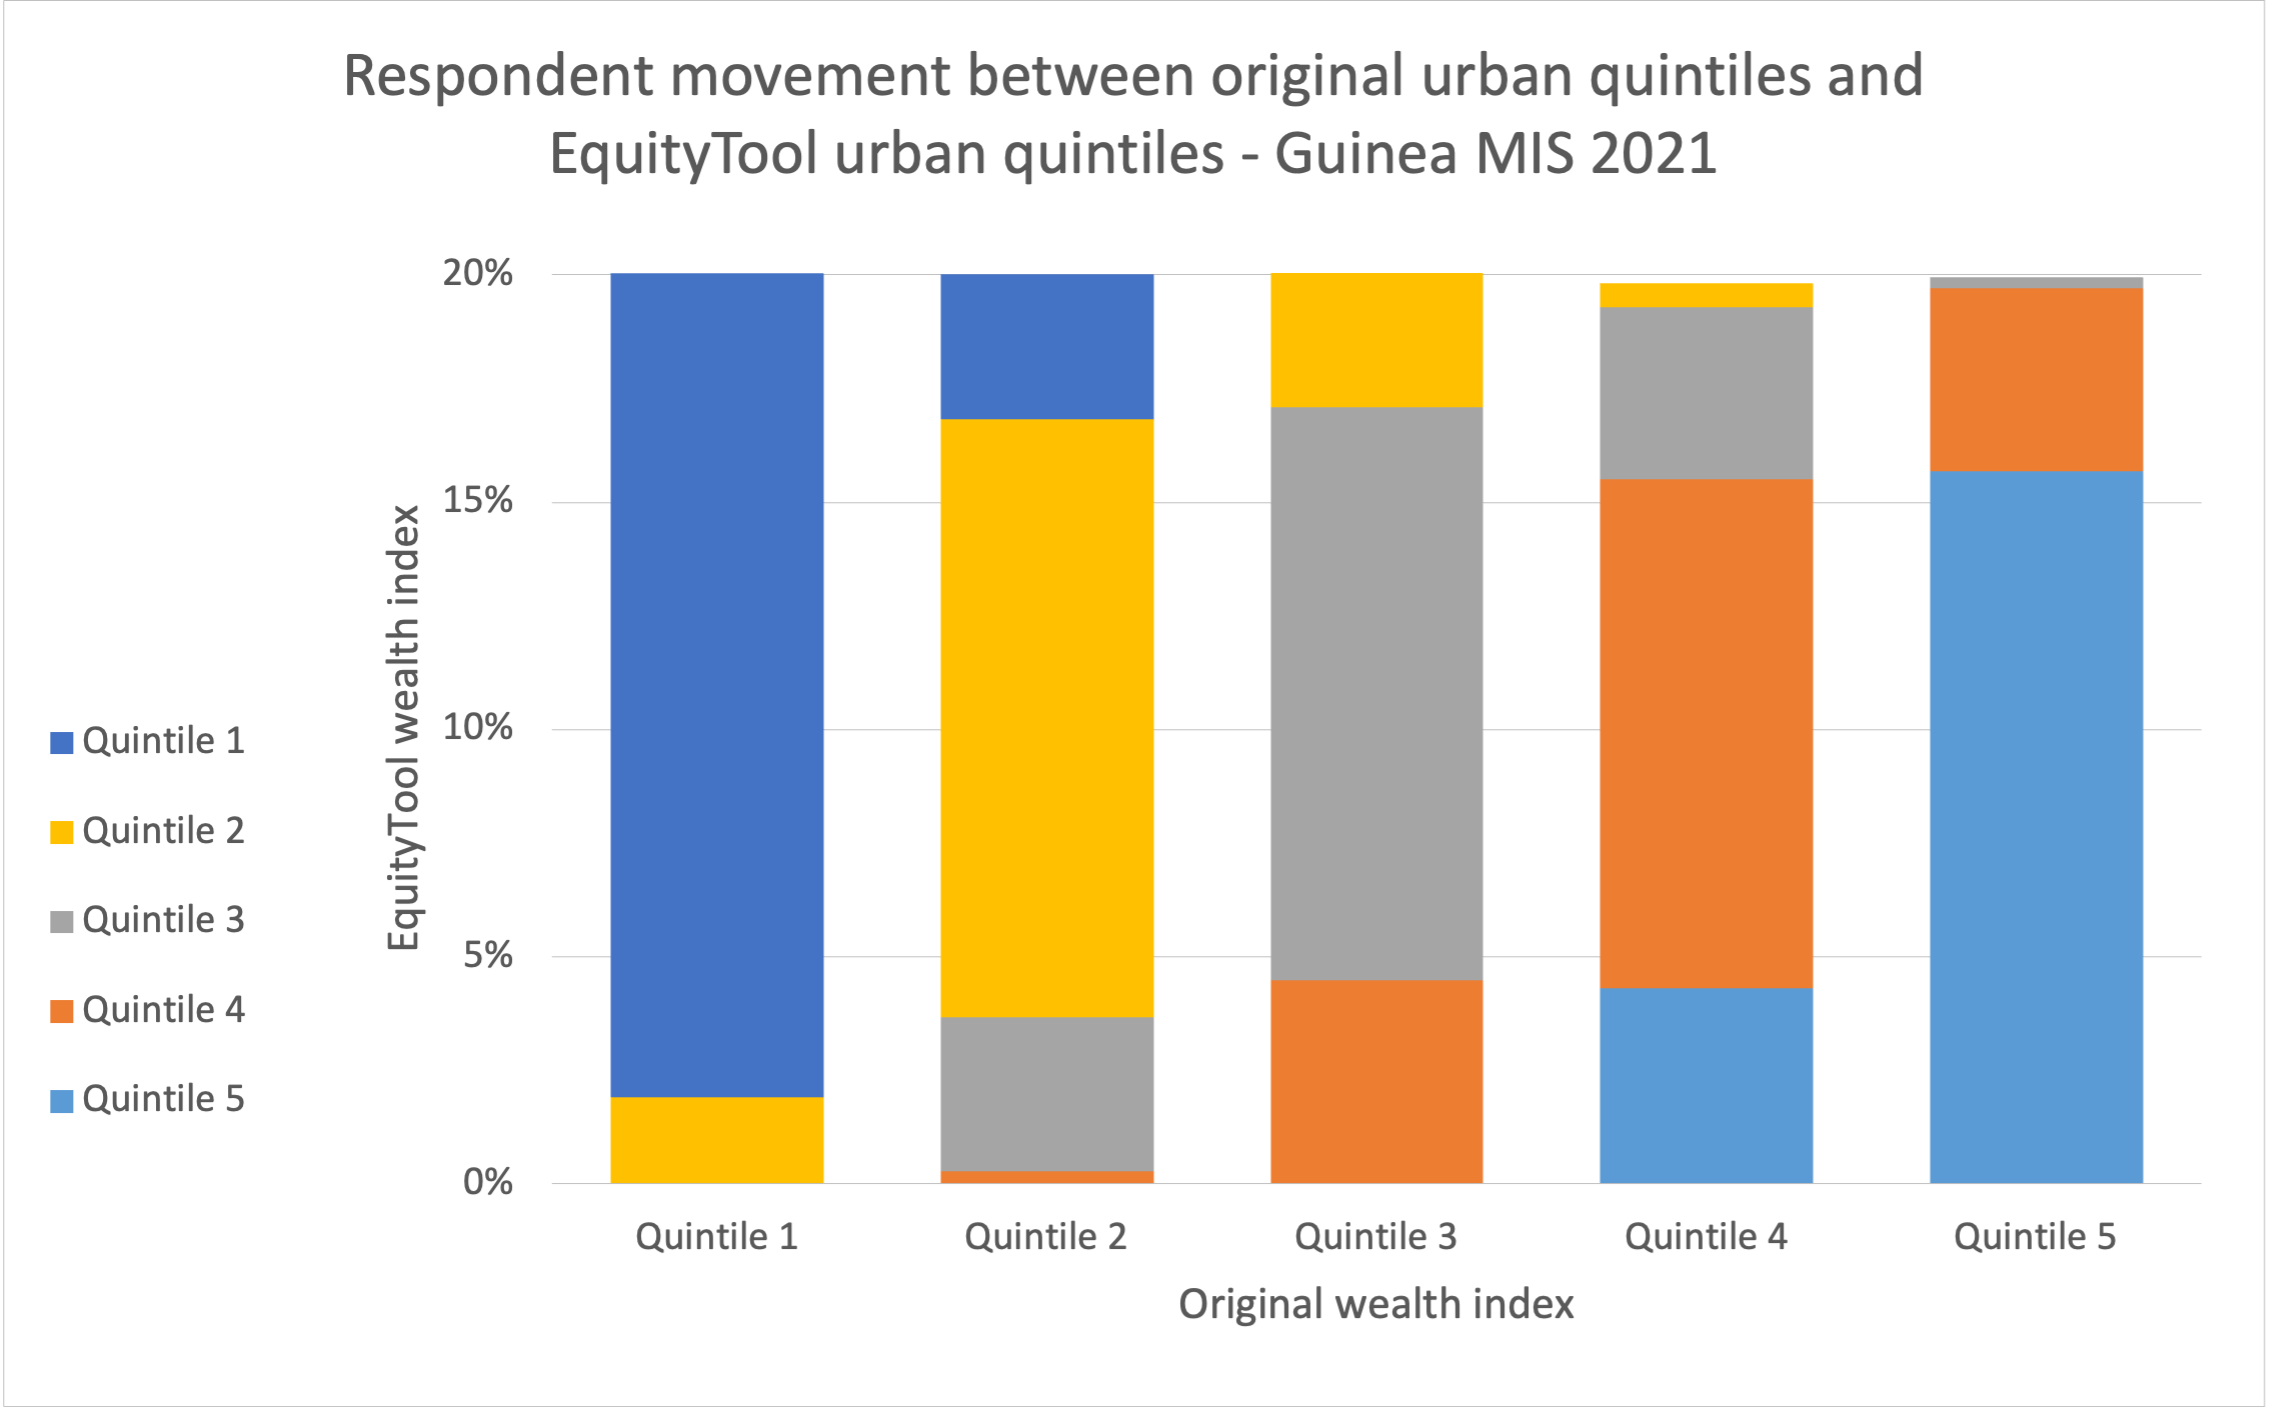
The following table provides the same information on the movement between urban quintiles when using the EquityTool versus the original MIS wealth index:
| EquityTool Urban Quintiles | |||||||
| Quintile 1 | Quintile 2 | Quintile 3 | Quintile 4 | Quintile 5 | Total | ||
| Original MIS Urban Quintiles | Quintile 1 | 18.1% | 1.9% | 0.0% | 0.0% | 0.0% | 20% |
| Quintile 2 | 3.2% | 13.2% | 3.4% | 0.3% | 0.0% | 20% | |
| Quintile 3 | 0.1% | 3.0% | 12.6% | 4.5% | 0.0% | 20% | |
| Quintile 4 | 0.0% | 0.5% | 3.8% | 11.2% | 4.3% | 20% | |
| Quintile 5 | 0.0% | 0.0% | 0.2% | 4.0% | 15.7% | 20% | |
| Total | 21.38% | 18.62% | 20.00% | 19.99% | 20.00% | 100% | |
Data interpretation considerations:
- This tool provides information on relative wealth – ‘ranking’ respondents within the national or urban population. The most recent available data from the WorldBank indicates that 11.7% of people in Guinea live below $3/day[1]. This information can be used to put relative wealth into context.
- People who live in urban areas are more likely to be wealthy. In Guinea, 59% of people living in urban areas are in the richest national quintile, compared to only 2% of those living in rural areas[2].
- If your population of interest is predominantly urban, we recommend you look at the urban results to understand how relatively wealthy or poor they are, in comparison to other urban dwellers.
- If the people you interviewed using the EquityTool live in rural areas, or a mix of urban and rural areas, we recommend using the national results to understand how relatively wealthy or poor they are, in comparison to the whole country.
- Some regions in Guinea are wealthier than others. It is important to understand the country context when interpreting your results.
- In most cases, your population of interest is not expected to be equally distributed across the five wealth quintiles. For example, if your survey interviewed people exiting a shopping mall, you would probably expect most of them to be relatively wealthy.
| Previous | Current | |
| Source Data | 2012 DHS | 2021 MIS |
| # of questions in EquityTool | 10 | 13 |
| # of questions in full wealth index | 37 | 48 |
| # of variables in EquityTool | 15 | 14 |
| # of variables in full wealth index | 113 | 129 |
| Kappa statistic (EquityTool vs full wealth Index) for 3 groups | National: 0.75 Urban: 0.753 | National: 0.79 Urban: 0.75 |
Compared to the previous EquityTool some of the questions and variables included have changed.
The previous EquityTool included 15 variables. Of those 15 variables, 7 are still included in the current EquityTool.
| 1. Electricity | 5. Bank account |
| 2. Television | 6. Wall material: cement |
| 3. Refrigerator | 7. Cooking fuel: wood |
| 4. Bookshelf |
Six variables are included in the new EquityTool that were not included in the previous EquityTool.
| 1. Wardrobe | 4. Android phone |
| 2. Sofa | 5. Cooking stove: Three stone fire/ open fire |
| 3.Fan | 6. Floor material: ceramic tiles |
It is generally best to use the current version of the EquityTool, since it will give a more accurate quintile estimate. If you are currently collecting data, it is best to continue to use the previous tool. Note that if you have created a survey in the EquityTool web application using the previous EquityTool, that survey will continue to use the previous EquityTool.
If conducting a follow-up survey to a baseline that used the previous EquityTool, and the most important result is change from the baseline, it may be preferable to continue to use the previous EquityTool for comparability. If you need to do this, please contact us at support@equitytool.org.
Contextualizing Changes in the EquityTool
Comparing the results of surveys that used the previous EquityTool against those that use the current EquityTool is difficult. It will not always be clear whether any difference is because of actual differences in the wealth level of the respondents or because the EquityTool has changed.
The section below provides relevant contextual information that may help a user understand why the EquityTool has changed from the previous tool.
Changes in Asset Ownership
Over time, patterns of asset ownership change. This may reflect the fact that an asset which previously was quite expensive has become more affordable over time, making it more accessible to a large population or that the population has grown wealthier and now a larger portion of the population is able to afford more expensive goods. Likewise, some assets may simply become more or less prevalent due to technological changes. As asset ownership patterns change, their ability to help us distinguish between wealth quintiles may also change.
In Figure 1 we show how ownership of the assets in the original benchmark survey and the current benchmark survey have changed [2]. Variables that are not included in both DHS surveys are not shown in this graph. Assets in red appear in both the current and previous versions of the EquityTool.
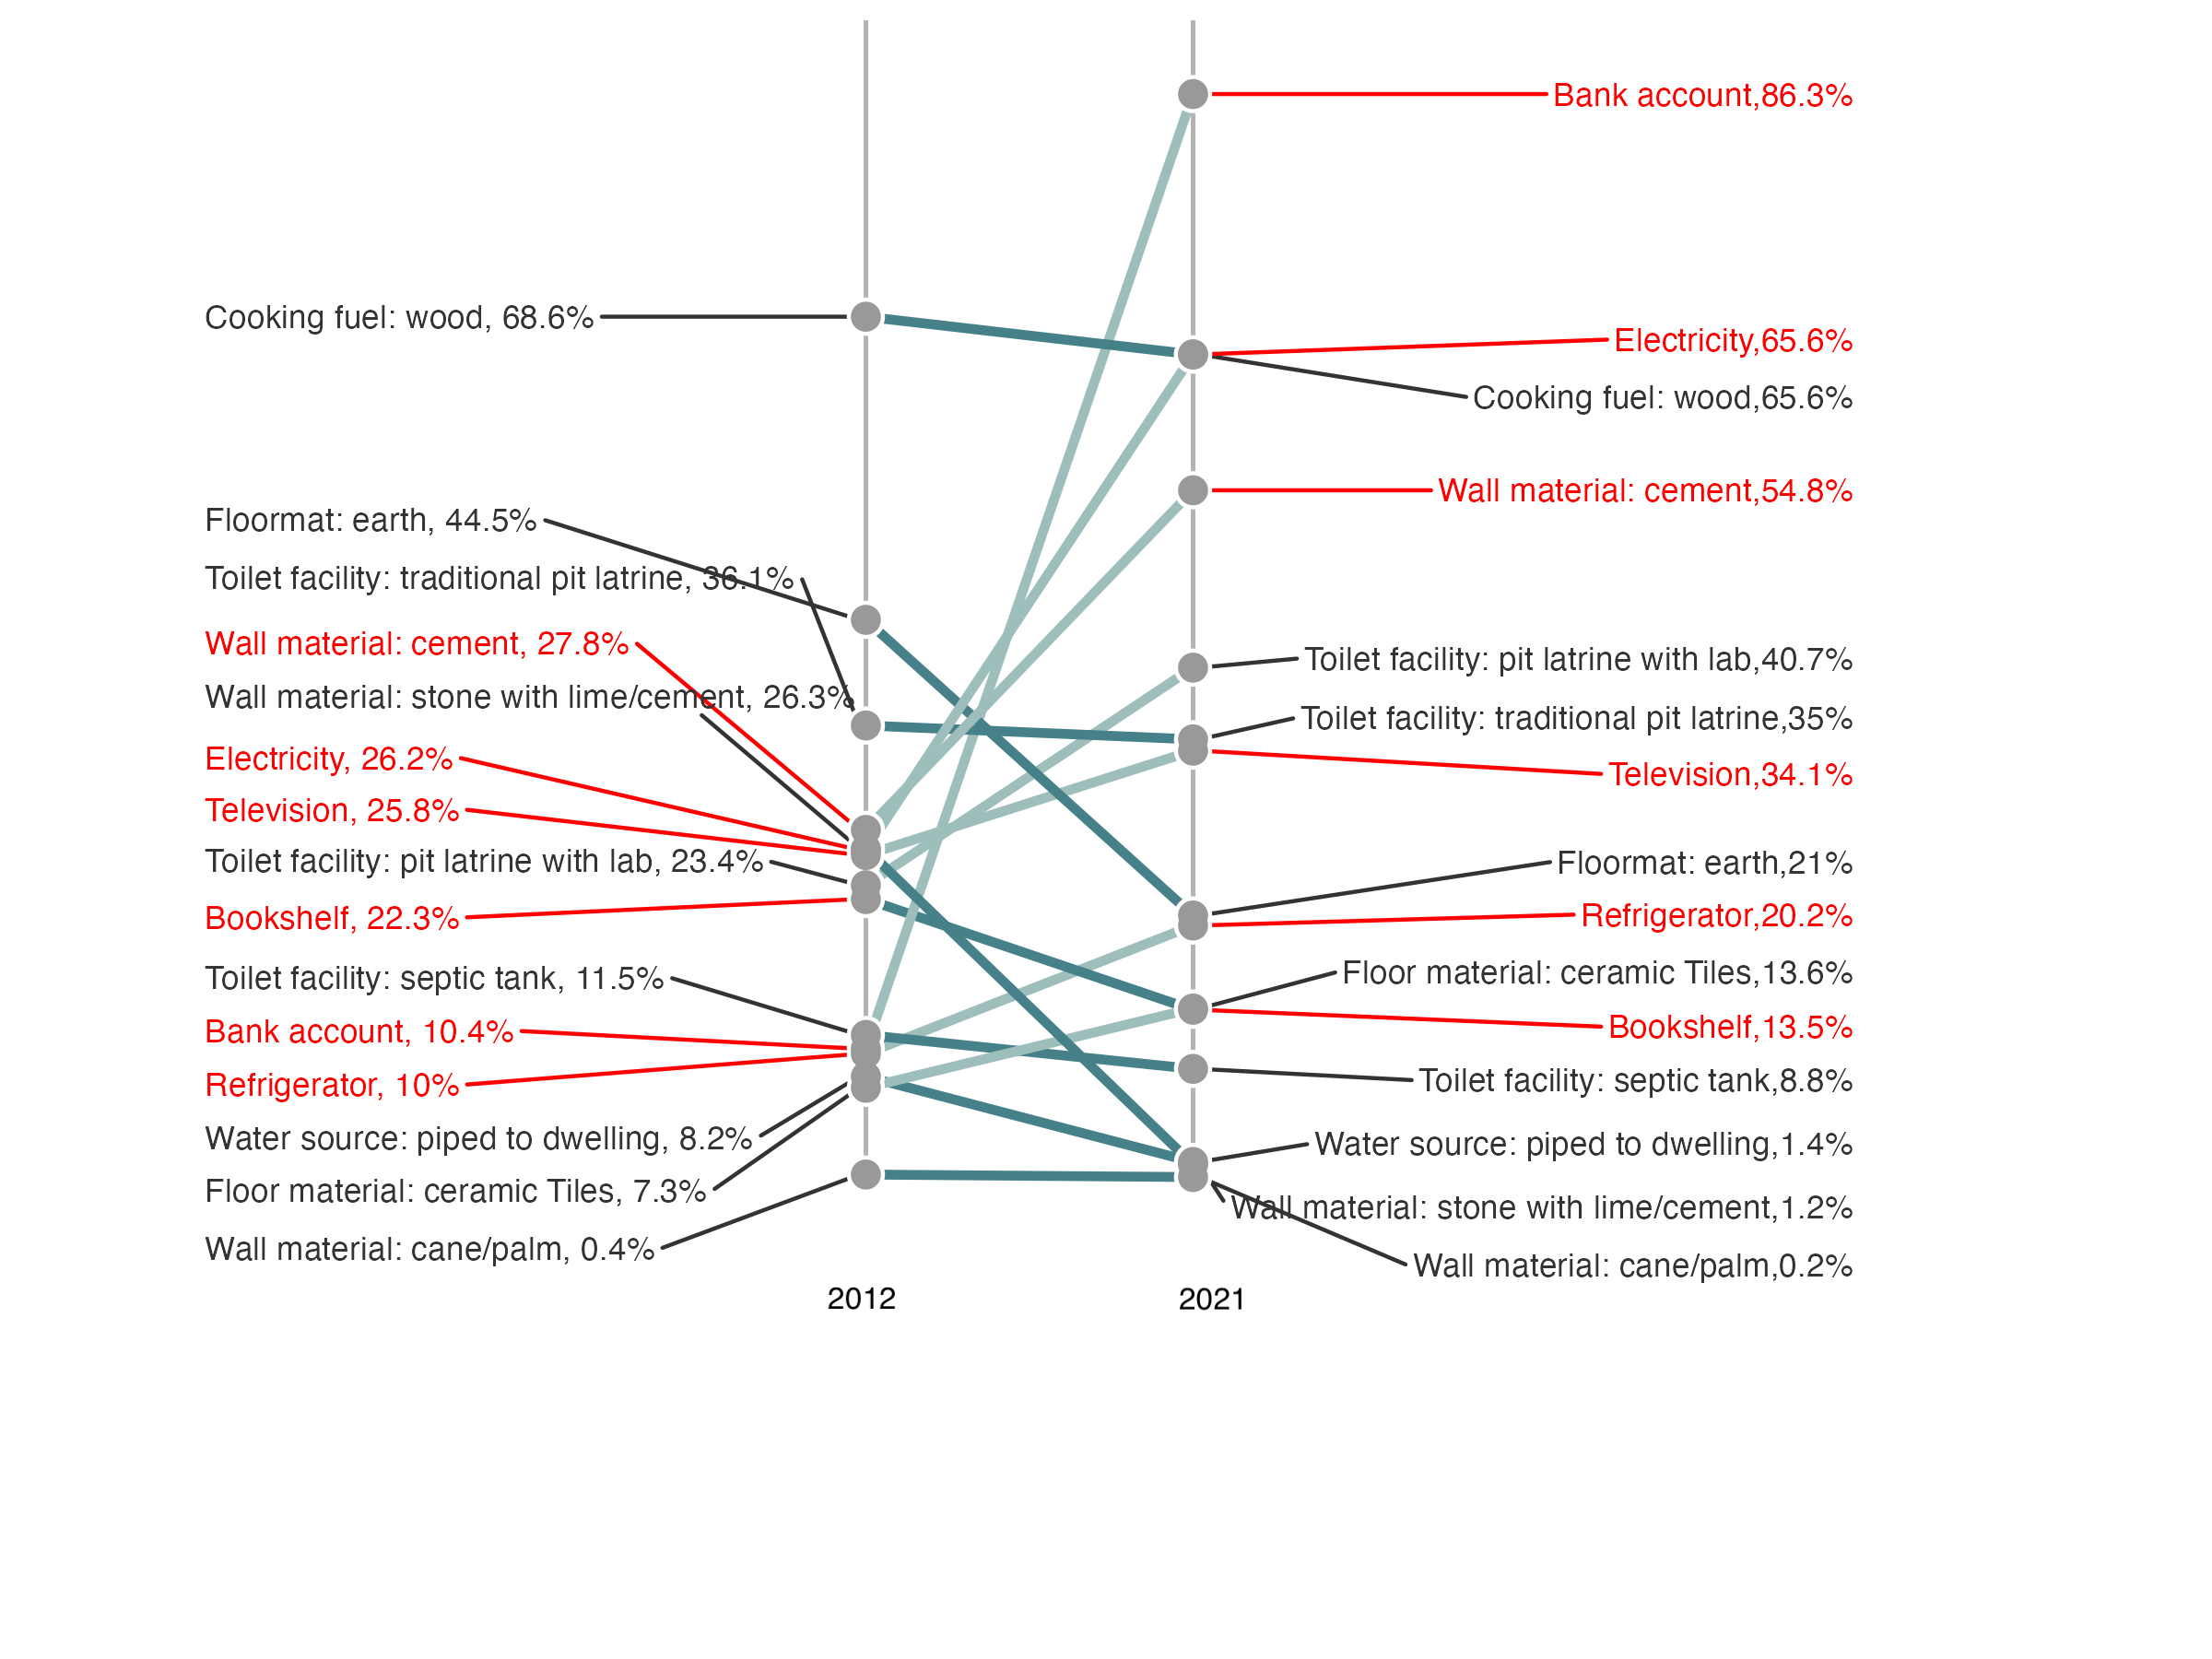
Between 2012 and 2021, there were some notable changes in Guinea’s asset ownership rates. For example, the percentage of households with bank accounts increased by more than 70 percentage points, and the percentage of households with cement wall material increased by nearly 30 percentage points. However, the percentage of households with wall material: stone with lime/cement declined by more than 20 percentage points.
Changes in Country Context
Changes in the EquityTool often reflect changes in the economic well-being of the population. As the population wealth changes, the prevalence of different assets may change.
The following table provides a summary of some key indicators that illustrate how the economic well-being of the population of Guinea has changed from 2012 to 2021.
Previous Survey: DHS 2012 | Current Survey: MIS 2021 | |
| Percent of the population living below the $3 per day poverty line [1] | 21.26% (2012) | 11.65% (2018) |
| Percent of the population that is multidimensionally poor [3] | 71.23% (DHS 2012) | 64.95% (DHS 2018) |
| GDP per capita [4] | $2763 | $3739 |
| Average annual GDP growth from 2012 to 2021 [5] | 6.07% | |
The GDP per capita and annual GDP indicate that Guinea’s economy grew between 2012 and 2021. Accompanying this economic growth has also been a decrease in the poverty headcount as measured by the international poverty line. This economic improvement, over time, will reduce the previous Guinea EquityTool’s ability to accurately assign households to their most correct wealth quintiles.
Metrics for Management provides technical assistance services to those using the EquityTool, or wanting to collect data on the wealth of their program beneficiaries. Please contact support@equitytool.org and we will assist you.
[1] From pip.worldbank.org, reporting poverty headcount ratio at $3/day at 2021 international prices.
[2] From the Guinea dataset household recode, available at http://dhsprogram.com/
[3] From Oxford Poverty and Human Development Initiative (October 2024). “Guinea Country
Briefing”, Oxford Poverty and Human Development Initiative, University of Oxford.
[4] From data.worldbank.com, reporting GDP per capita, PPP (constant 2021 international $)
[5] From data.worldbank.com, reporting average of GDP growth (annual %)
